Star Schema Benchmark
by P O'Neil 2009
https://www.cs.umb.edu/~poneil/StarSchemaB.PDF
星型模型在数仓中使用广泛,在该模型中,多个维表(dimension tables)围绕一个事实表(fact table),因此可以减少不必要的外键及 join,查询复杂度较低,但却由于不严格遵循范式,存储在数据冗余。
Star Schema Benchmark 将 TPC-H 的雪花模型改造成了星型模式,以测试数仓在决策支持场景下性能表现。
We depart from the TPC-H query format for a number of reasons, most commonly to make an attempt to provide the
Functional CoverageandSelectivity Coveragefeatures.
对于查询语句的选择,SSB 主要考虑:
- Functional Coverage: 尽可能选择星型模式中常见的重要查询以满足用户的预期
- Selectivity Coverage: 通过对维表条件的选择可以决定事实表检索的数量(total Filter Factor)
SSB 的表结构
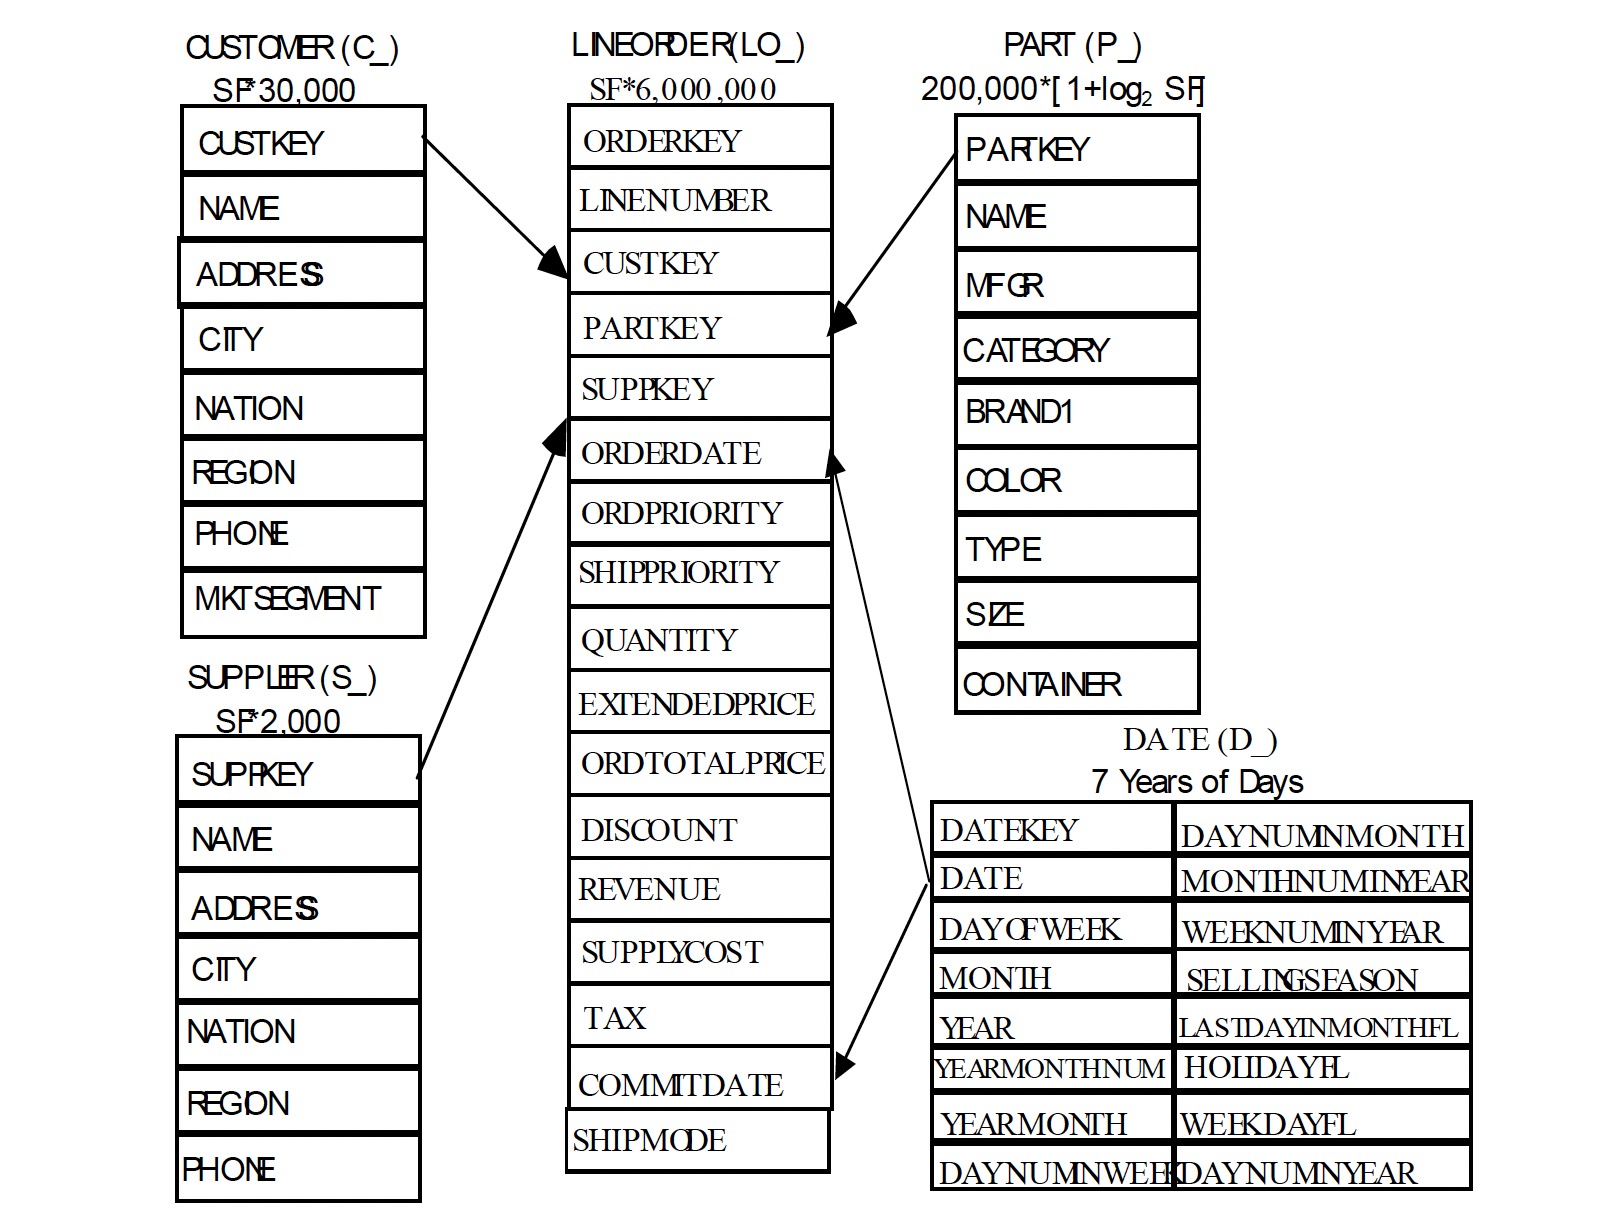
事实表将 TPC-H 中的 LINEITEM 和 ORDERS 进行了合并,更加符合数仓的标准,增加了冗余,同时减少了在查询过程中不必要的 join 计算。
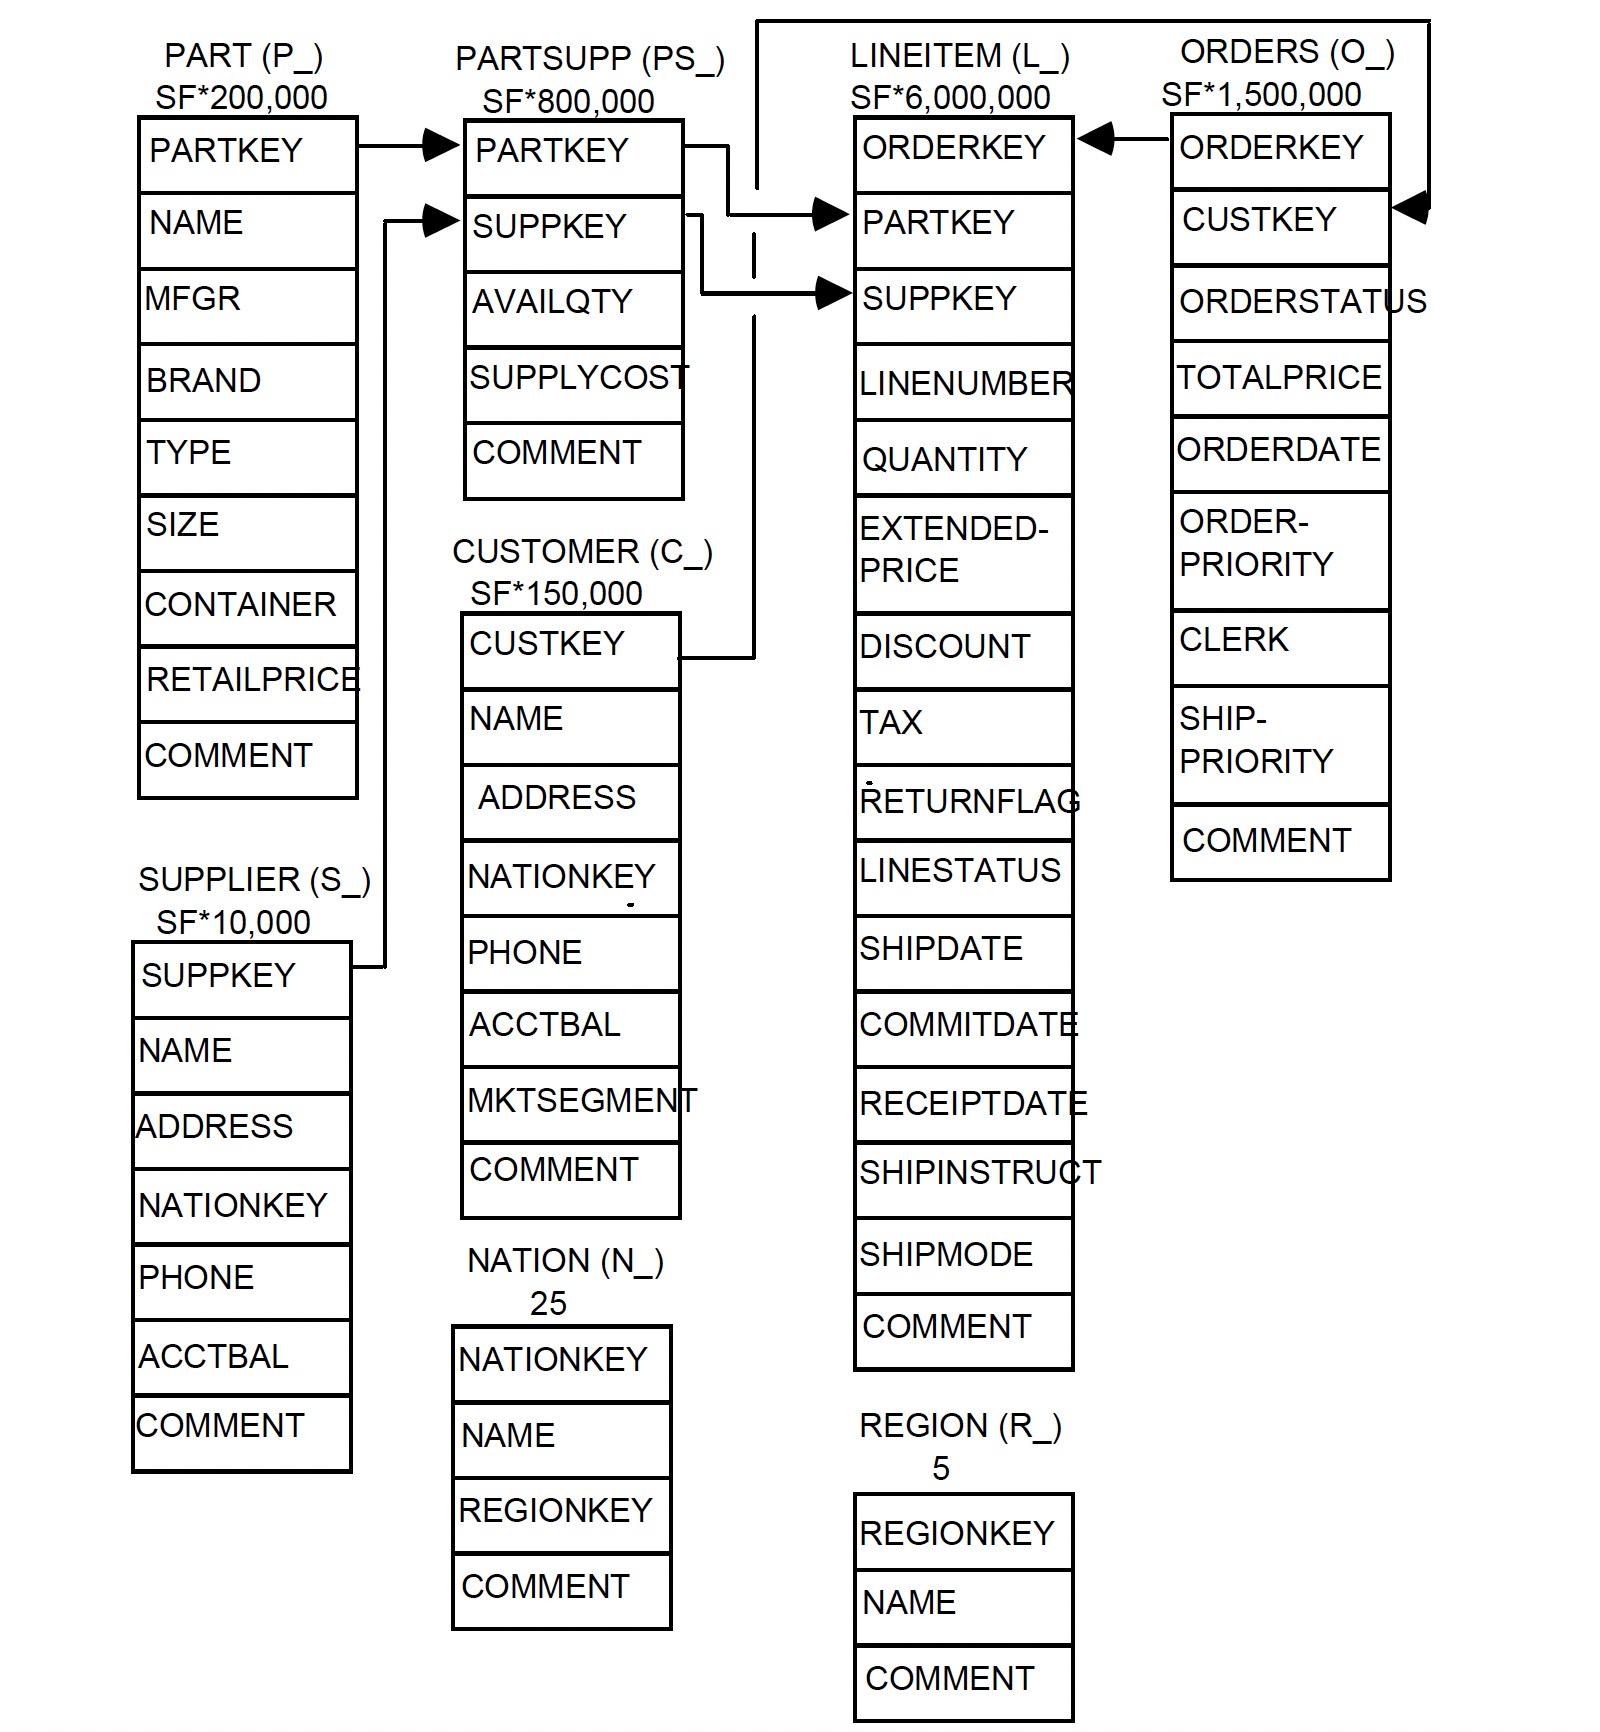
对比 TPC-H 的表结构为:
SSB Queries
Q1: 选择一个维表(date)作为查询过滤条件,计算给定日期范围内,折扣和销售数量在某个范围内的订单的销售收入之和。
select sum(lo_extendedprice * lo_discount) as revenue
 from lineorder, date
 where lo_orderdate = d_datekey
  and [DATE_FILTER]
  and [LO_DISCOUNT_FILTER]
  and [LO_QUANTITY_FILTER];
Q2: 对两个维表(part、supplier)进行查询过滤,计算每个品牌每年带来的收入之和。
select sum(lo_revenue), d_year, p_brand1
 from lineorder, date, part, supplier
 where lo_orderdate = d_datekey
  and lo_partkey = p_partkey
  and lo_suppkey = s_suppkey
  and [PART_FILTER]
  and [S_REGION_FILTER]
 group by d_year, p_brand1
 order by d_year, p_brand1;
Q3: 对三个维表(customer、supplier 和 date)进行查询过滤,根据客户所在国家、供应商所在国家及日期限制计算收入之和。
select c_nation, s_nation, d_year, sum(lo_revenue) as revenue
 from customer, lineorder, supplier, date
 where lo_custkey = c_custkey
  and lo_suppkey = s_suppkey
  and lo_orderdate = d_datekey
  and [CUSTOMOR_FILTER]
  and [SUPPLIER_FILTER]
  and [DATE_FILTER]
 group by c_nation, s_nation, d_year
 order by d_year asc, revenue desc;
Q4: 对四个维表(全部)进行查询过滤:
Q4.1
select d_year, c_nation, sum(lo_revenue - lo_supplycost) as profit
 from date, customer, supplier, part, lineorder
 where lo_custkey = c_custkey
  and lo_suppkey = s_suppkey
  and lo_partkey = p_partkey
  and lo_orderdate = d_datekey
  and c_region = 'AMERICA'
  and s_region = 'AMERICA'
  and (p_mfgr = 'MFGR#1' or p_mfgr = 'MFGR#2')
 group by d_year, c_nation
 order by d_year, c_nation;
Q4.2
select d_year, s_nation, p_category, sum(lo_revenue - lo_supplycost) as profit
 from date, customer, supplier, part, lineorder
 where lo_custkey = c_custkey
  and lo_suppkey = s_suppkey
  and lo_partkey = p_partkey
  and lo_orderdate = d_datekey
  and c_region = 'AMERICA'
  and s_region = 'AMERICA'
  and (d_year = 1997 or d_year = 1998)
  and (p_mfgr = 'MFGR#1' or p_mfgr = 'MFGR#2')
 group by d_year, s_nation, p_category
 order by d_year, s_nation, p_category;
Q4.3
select d_year, s_city, p_brand1, sum(lo_revenue - lo_supplycost) as profit
 from date, customer, supplier, part, lineorder
 where lo_custkey = c_custkey
  and lo_suppkey = s_suppkey
  and lo_partkey = p_partkey
  and lo_orderdate = d_datekey
  and c_region = 'AMERICA'
  and s_nation = 'UNITED STATES'
  and (d_year = 1997 or d_year = 1998)
  and p_category = 'MFGR#14'
 group by d_year, s_city, p_brand1
 order by d_year, s_city, p_brand1;
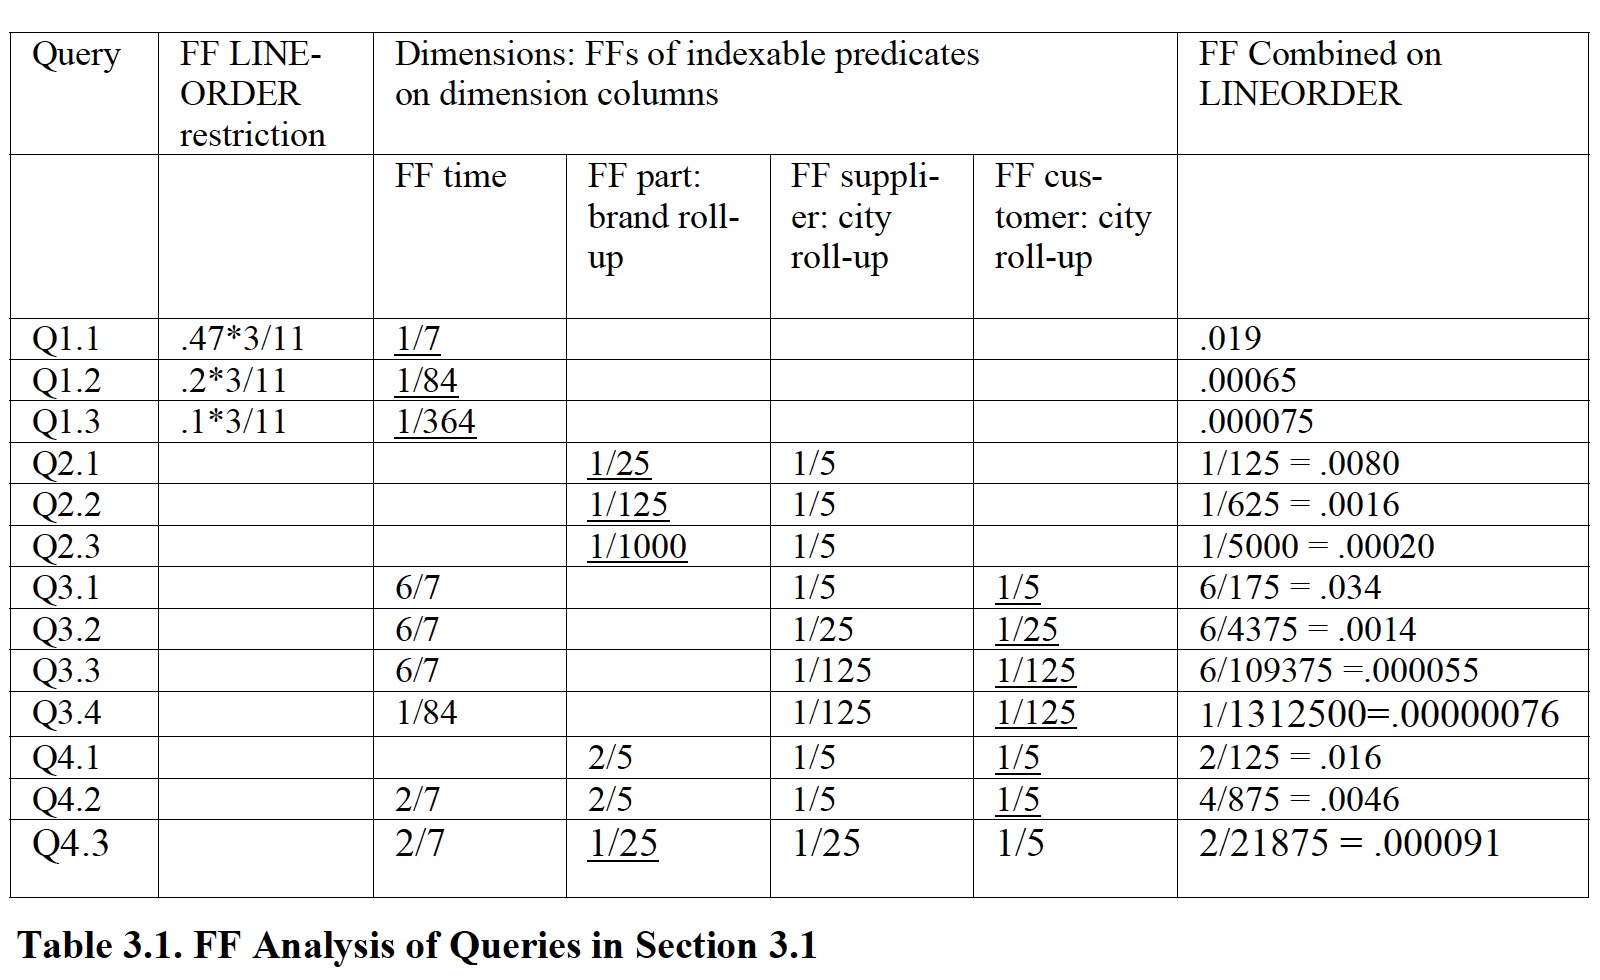
四类查询共 13 个查询对事实表的 Filter Factor 如下表所示:
References:
[1] Star Schema Benchmark data set generator (ssb-dbgen)
[2] Difference between Star Schema and Snowflake Schema